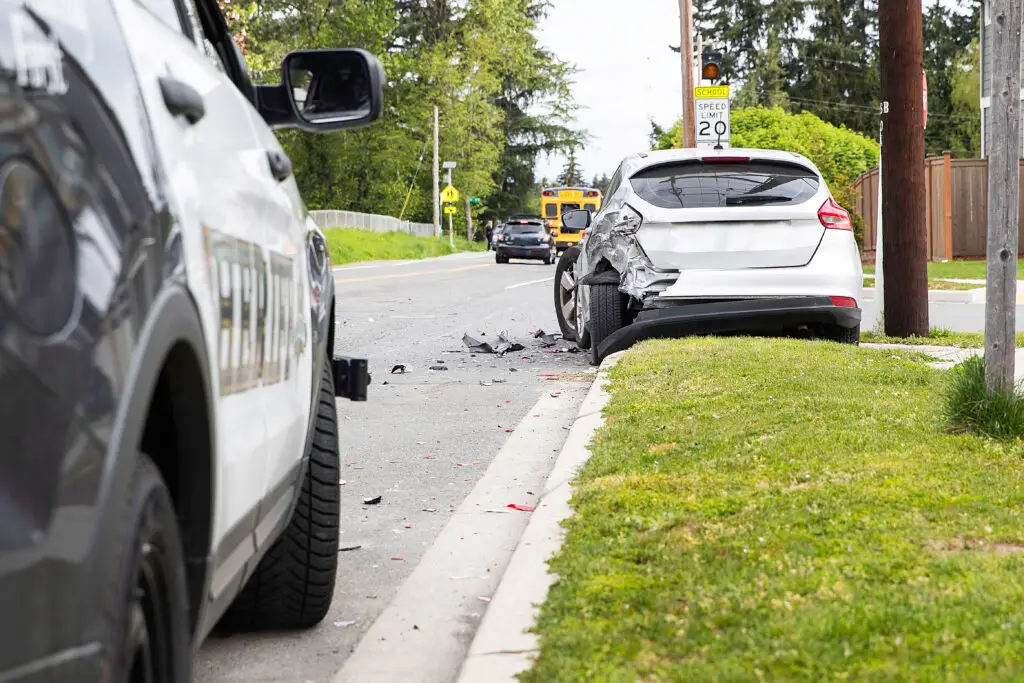
Texas is getting safer on the road. Fort Bend County is not.
That is the clearest finding in the Texas Department of Transportation’s 2025 crash tables, released this spring. Statewide, traffic deaths fell to 3,769 — the lowest total since before the pandemic and a 15% drop from the 2021 peak. Harris County deaths fell 11%. The City of Houston recorded nearly 10% fewer crashes than it did four years ago.
Fort Bend County went the other way. In 2025 the county recorded 57 traffic deaths — the highest total in at least six years — and it did so in a year when the number of crashes actually went down.
Fewer collisions. More funerals. That combination is worth understanding, and our office sits in the middle of it, on the Southwest Freeway in Sugar Land.
Key findings
- Fort Bend County recorded 57 traffic deaths in 2025, up from 41 in 2024 — a 39% increase in a single year, and the county’s worst total in the six-year record.
- Total Fort Bend crashes fell 3.1% in 2025 (13,217 to 12,801). Crashes went down while deaths went up.
- Sugar Land recorded 11 fatal crashes in 2025 — more than any year on record — resulting in 11 deaths, the city’s second-deadliest year after 2023.
- Sugar Land crashes are up 39% since 2021 (1,594 to 2,219), while Houston’s fell 10% over the same period.
- US and state highways accounted for 24 of Fort Bend’s 57 deaths — 42% of the county’s fatalities on a fraction of its road miles.
- Commercial trucks were involved in 3.8% of Fort Bend crashes but 12.3% of its deaths.
- Fort Bend now ranks 10th of Texas’s 254 counties for annual traffic deaths.
The state improved. Our county didn’t.
The honest way to read crash data is to compare a place against its own trend and against the state around it. Do that, and Fort Bend stands out.
We use 2021 as the baseline rather than 2020, because 2020 traffic volumes were suppressed by the pandemic and any comparison against that year overstates growth. Here is how each place changed between 2021 and 2025.
| Area | Crashes 2021 | Crashes 2025 | Change | Deaths 2021 | Deaths 2025 | Change |
|---|---|---|---|---|---|---|
| Sugar Land | 1,594 | 2,219 | +39.2% | 8 | 11 | +37.5% |
| Fort Bend County | 9,647 | 12,801 | +32.7% | 54 | 57 | +5.6% |
| Harris County | 114,760 | 107,472 | −6.4% | 567 | 503 | −11.3% |
| City of Houston | 66,895 | 60,317 | −9.8% | 322 | 293 | −9.0% |
| Texas statewide | 552,677 | 538,860 | −2.5% | 4,456 | 3,769 | −15.4% |
Every column tells the same story. The two Fort Bend rows go up. Everything else goes down.
Sugar Land: six years of data
Sugar Land’s crash volume has grown almost without interruption since 2020, from 1,176 crashes to 2,219 — an 89% increase, though again, 2020 is a distorted baseline.
| Year | Fatal crashes | Deaths | Serious injury crashes | Serious injuries | Total crashes |
|---|---|---|---|---|---|
| 2020 | 2 | 2 | 25 | 26 | 1,176 |
| 2021 | 8 | 8 | 28 | 32 | 1,594 |
| 2022 | 4 | 4 | 38 | 50 | 1,729 |
| 2023 | 9 | 12 | 36 | 51 | 1,972 |
| 2024 | 7 | 8 | 28 | 34 | 2,189 |
| 2025 | 11 | 11 | 36 | 45 | 2,219 |
Two things stand out. First, 2025 produced 11 fatal crashes — more than any other year in the record, and well above the six-year average of about seven. Second, total crashes were essentially flat between 2024 and 2025, rising just 1.4%, while deaths rose 37.5%. The crashes did not multiply. They got worse.
Serious injuries followed the same path, climbing from 34 in 2024 to 45 in 2025. These are the collisions that produce surgeries, permanent impairment, and months away from work — the cases that turn into car accident claims and, in the worst outcomes, wrongful death claims.
Fort Bend County: fewer crashes, deadlier ones
| Year | Fatal crashes | Deaths | Serious injury crashes | Serious injuries | Total crashes |
|---|---|---|---|---|---|
| 2020 | 30 | 31 | 187 | 223 | 8,028 |
| 2021 | 48 | 54 | 243 | 304 | 9,647 |
| 2022 | 36 | 36 | 251 | 311 | 10,527 |
| 2023 | 41 | 44 | 249 | 314 | 11,601 |
| 2024 | 38 | 41 | 257 | 313 | 13,217 |
| 2025 | 52 | 57 | 242 | 297 | 12,801 |
2025 broke the county’s record on both fatality measures: 52 fatal crashes and 57 deaths, surpassing the previous highs of 48 and 54 set in 2021. It did so while total crashes declined by 416 from the 2024 peak.
A county can produce more deaths from fewer crashes for a handful of reasons: higher impact speeds, a shift in where collisions happen, more vulnerable road users, or heavier vehicles involved. The rest of TxDOT’s 2025 tables point at the first two.
Where people are dying in Fort Bend County
TxDOT breaks fatal crashes out by road type. In Fort Bend County, the deaths cluster hard on high-speed arterials.
| Road type | Fatal crashes | Deaths | Share of deaths |
|---|---|---|---|
| US & state highways | 21 | 24 | 42.1% |
| County roads | 11 | 13 | 22.8% |
| Farm-to-market roads | 9 | 9 | 15.8% |
| Interstate | 8 | 8 | 14.0% |
| City streets | 3 | 3 | 5.3% |
| Total | 52 | 57 | 100% |
US and state highways — the category that includes Highway 6 and US 90A — killed more people in Fort Bend County than the Interstate, farm-to-market roads, and city streets combined (24 deaths against 20). City streets, where speeds are lowest, accounted for just three.
This is the geometry of a suburban county absorbing metropolitan traffic volumes on roads that were designed for something smaller.
What’s behind the crashes
Speed
Speed was a factor in 3,901 Fort Bend crashes in 2025 — 30.5% of every collision in the county — including 17 fatal crashes and 87 serious injuries. Roughly three in ten Fort Bend traffic deaths involved speed.
Distracted driving
Distraction was recorded in 1,192 Fort Bend crashes (9.3% of the total), causing five deaths and 30 serious injuries. Distraction is almost certainly undercounted — it depends on a driver admitting it or an officer inferring it at the scene.
Commercial trucks
Commercial motor vehicles were involved in 489 Fort Bend crashes — only 3.8% of the county total — but those crashes produced seven deaths, or 12.3% of all Fort Bend fatalities.
Put plainly: a crash involving a commercial truck is roughly three times more likely to kill someone than the average Fort Bend crash. Mass and stopping distance do that. Truck accident claims also tend to involve commercial insurance policies, federal safety regulations, and corporate defendants, which makes them structurally different from a two-car collision.
Drunk driving in Sugar Land
Sugar Land recorded 52 DUI-related crashes in 2025 — 2.3% of the city’s collisions. Those 52 crashes caused two of the city’s 11 traffic deaths, or 18%.
A DUI crash in Sugar Land was, on the 2025 numbers, roughly eight times more likely to be fatal than a typical crash in the same city. Drunk driving cases may also involve dram shop liability where a bar or restaurant over-served the driver.
Fort Bend cities compared
| City | Fatal crashes | Deaths | Serious injuries | Total crashes |
|---|---|---|---|---|
| Sugar Land | 11 | 11 | 45 | 2,219 |
| Missouri City | 1 | 1 | 22 | 1,154 |
| Rosenberg | 5 | 5 | 32 | 849 |
| Stafford | 0 | 0 | 10 | 634 |
| Richmond | 1 | 1 | 5 | 264 |
| Fulshear | 0 | 0 | 6 | 178 |
Sugar Land recorded more traffic deaths in 2025 than every other named Fort Bend city combined. It is the county’s largest city and carries the heaviest traffic load, so volume explains part of that. But volume does not explain the rate: about one in every 200 Sugar Land crashes was fatal, against roughly one in 1,150 in Missouri City.
Motorcyclists: 15% of Texas traffic deaths
TxDOT does not publish motorcycle crash counts by county, so this section is statewide. It is still worth reading if you ride in Fort Bend.
559 motorcyclists died on Texas roads in 2025 — 14.8% of all traffic deaths in a state where motorcycles are a small fraction of registered vehicles. Another 2,470 motorcyclists suffered suspected serious injuries.
| Helmet use | Fatalities | Serious injuries |
|---|---|---|
| Helmet worn | 359 | 1,525 |
| Helmet not worn | 173 | 821 |
| Unknown | 27 | 124 |
| Total | 559 | 2,470 |
One caution about reading this table: most Texas riders wear helmets, so most riders who die are wearing one. These figures record helmet use at the time of the crash. They are not, on their own, a measure of how much protection a helmet provides, and they say nothing about who caused the collision.
That distinction matters in a claim. Insurers routinely raise helmet use when a rider is hurt, and how Texas comparative fault rules apply to that argument is a fact-specific question worth asking a lawyer about early. If you were hurt riding, our motorcycle accident page explains how we approach these cases.
People on foot and on bikes
Statewide in 2025, 695 pedestrians and 91 bicyclists were killed in traffic crashes, out of 5,965 and 2,863 crashes respectively.
Combine those with motorcyclists and the picture sharpens: 1,345 of Texas’s 3,769 traffic deaths in 2025 — nearly 36% — were people who had no steel cage around them. They represent a small share of trips and a third of the deaths.
See our pages on pedestrian accidents and bicycle accidents.
What’s being done about it
Sugar Land is currently developing a Safety Action Plan with the Houston-Galveston Area Council, analyzing crash data from 2018 through 2024 across the city. H-GAC is running twelve of these plans across the region, which by its own account absorbs close to 20% of all Texas traffic deaths — an average of two deaths and ten serious injuries every day.
Recommendations are being finalized now, with adoption targeted for November 2026 and the completed plan due in spring 2027. Residents can still comment through H-GAC’s interactive map and survey. If you drive Highway 6, US 90A, or the Southwest Freeway daily, that comment period is the most direct influence you have over what gets fixed.
Methodology and sources
Every figure on this page comes from the Texas Department of Transportation’s published annual crash statistics, derived from Texas Peace Officer’s Crash Reports (form CR-3). TxDOT’s 2025 tables reflect reports received and processed as of April 7, 2026.
- “Deaths” and “fatalities” count people killed. “Fatal crashes” count collisions. One crash can produce several deaths, which is why the two columns differ.
- “Serious injuries” uses TxDOT’s suspected serious injury classification, assigned by the responding officer, not a physician. It is an on-scene judgment.
- City figures cover incorporated city limits only. Much of Fort Bend County’s road mileage is unincorporated and appears only in county totals.
- We use 2021 rather than 2020 as the comparison baseline because 2020 traffic volumes were suppressed by the pandemic. Full 2020 figures are shown in the tables for transparency.
- Percentages are calculated from the raw counts shown and rounded to one decimal place.
Source documents: TxDOT Motor Vehicle Crash Statistics — Crashes and Injuries by County, Crashes and Injuries — Cities and Towns, Fatal Crashes and Fatalities by County and Road Type, Speed-Involved Crashes and Injuries by County, Distracted Driver Crashes and Injuries by County, CMV-Involved Crashes and Injuries by County, DUI (Alcohol) Crashes and Injuries — Cities and Towns, Motorcyclist Fatalities and Injuries by Age Group and Helmet Use, and Pedestrian and Pedalcyclist Injuries and Crashes, 2020–2025 editions. Safety planning data from H-GAC’s Sugar Land Safety Action Plan.
Journalists and researchers are welcome to cite this analysis with attribution and a link. We update it each year when TxDOT releases new tables.
Frequently asked questions
How many people died in Fort Bend County traffic crashes in 2025?
57 people died in 52 fatal crashes in Fort Bend County in 2025, according to TxDOT. That is the county’s highest annual total in at least six years, up from 41 deaths in 2024.
How many car accidents happen in Sugar Land each year?
Sugar Land recorded 2,219 crashes in 2025 — roughly six per day. That includes 11 fatal crashes, 36 serious injury crashes, and 1,739 crashes with no reported injury.
Which roads are most dangerous in Fort Bend County?
US and state highways — the category including Highway 6 and US 90A — accounted for 24 of the county’s 57 traffic deaths in 2025, or 42%. County roads accounted for 13 deaths, farm-to-market roads nine, and the Interstate eight. Only three deaths occurred on city streets.
Is traffic getting safer in Texas?
Statewide, yes. Texas traffic deaths fell from 4,456 in 2021 to 3,769 in 2025, a 15.4% decline. Fort Bend County is an exception to that trend, with deaths rising over the same period.
How long do I have to file a car accident claim in Texas?
Texas generally allows two years from the date of the crash to file a personal injury lawsuit. Exceptions exist — claims involving a governmental entity can require formal notice within months, sometimes as little as six. Because deadlines vary with the facts, talk to a lawyer well before the two-year mark.
If you were hurt in one of these crashes
Behind every number in these tables is a family. The 57 people Fort Bend County lost in 2025 were commuting on Highway 6, running errands on 90A, heading home down the Southwest Freeway.
Uzoma Sudarma Law Firm handles personal injury cases from our office on the Southwest Freeway in Sugar Land. If you or someone in your family was injured in a crash in Fort Bend or Harris County, your first consultation is free and there is no fee unless we win.
Request a free case review or call (832) 680-2380.
This article summarizes publicly available government data and is provided for general information. It is not legal advice and does not create an attorney-client relationship.